

Global Issue Summary
Track licensing, security, and quality issue trends across your entire organization from a single dashboard.
Enterprise feature
Available on: Business, Enterprise.
Overview
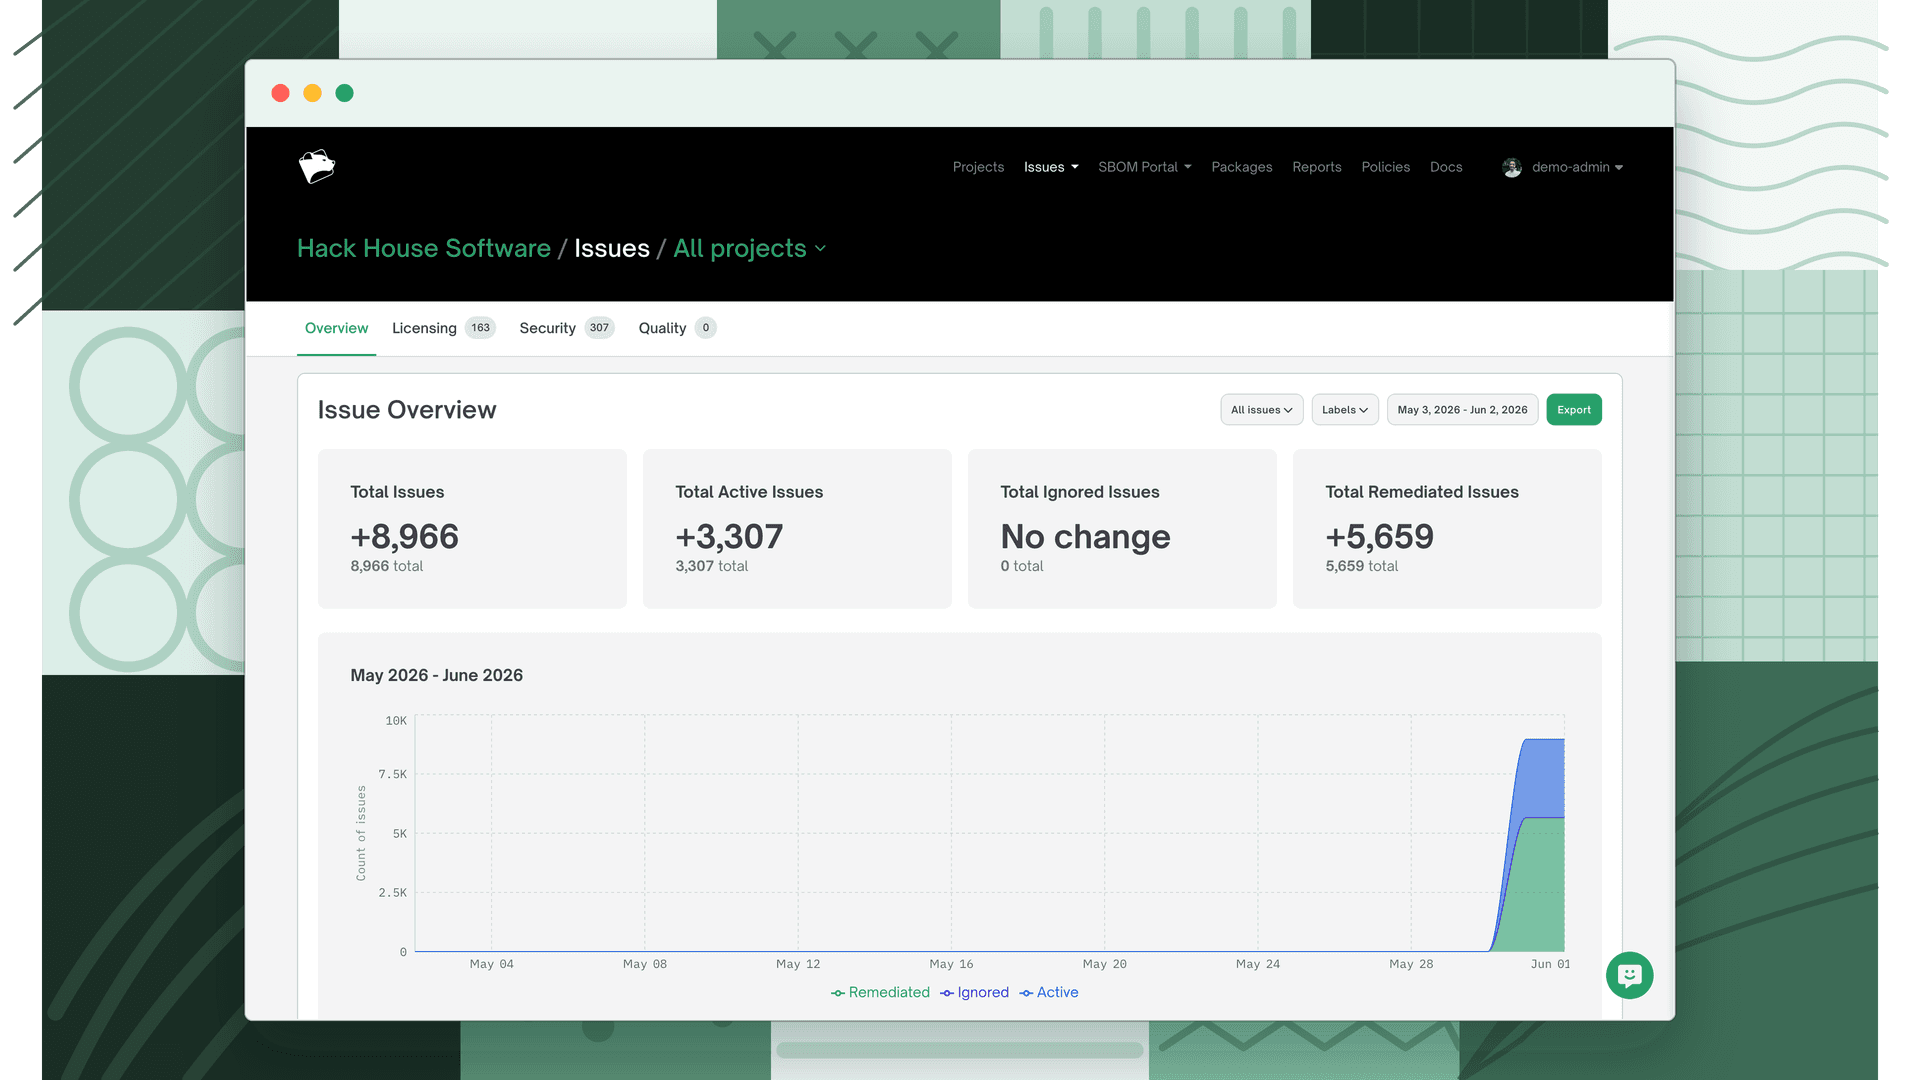
The Global Issue Summary (also called the Issue Overview) is an org-wide dashboard that aggregates licensing, security, and quality issues from every project in your organization. Use it to understand your overall compliance posture, track whether your issue count is trending up or down, and identify which issue types are driving risk.
It can also be scoped to a single project: the same view appears within a project's Issue Overview tab, showing only that project's data.
Note
The Issue Summary is built from daily snapshots. Data reflects the previous night's scan results and updates once every 24 hours.
Scope
The dashboard operates in two modes:
| Mode | Where to find it | What it shows |
|---|---|---|
| Global | Main navigation → Issues | All projects across your organization |
| Project | Inside a project → Issue Overview tab | That project only, on its latest revision of the default branch |
Note
When viewed from a project, the Issue Summary is only available for the latest revision of the default branch. Older revisions and non-default branches show a prompt to switch.
Filters
The filter bar at the top of the dashboard controls what data is shown throughout, KPI cards, history graph, and breakdowns all respond to the active filters.
| Filter | Description |
|---|---|
| Issue type | Narrow to Licensing, Security, or Quality issues only |
| Project labels | Filter to projects tagged with specific labels (global view only) |
| Teams | Filter to projects belonging to specific teams (global view only) |
| Date range | Set a historical window to analyze, defaults to the last 30 days |
KPI cards
Four cards summarize your current issue state at the end of the selected date range, each showing the count and the change (delta) from the start of the period:
| Card | What it counts |
|---|---|
| Total Issues | All issues in all states, active, ignored, and remediated combined |
| Total Active | Issues currently open and requiring attention |
| Total Ignored | Issues you've accepted or marked as not applicable |
| Total Remediated | Issues no longer present in the latest revision, resolved through a dependency update, removal, or an update to FOSSA's vulnerability database |
Note
KPI card totals count an issue once per project. If the same CVE affects five projects, it counts as five. The Licensing, Security, and Quality tabs deduplicate; each distinct issue is counted once regardless of how many projects it affects.
Issue history graph
The history graph shows how your issue counts changed across the selected date range. Three stacked data series show the breakdown at each point in time:
- Active: issues requiring attention
- Ignored: issues marked as accepted or suppressed
- Remediated: issues automatically resolved
Read the graph to see whether active issues are growing, shrinking, or stable, and whether remediations are keeping pace with new issues coming in.
Issue breakdown
Below the graph, the dashboard breaks down new issues by category. Only the categories enabled for your organization appear:
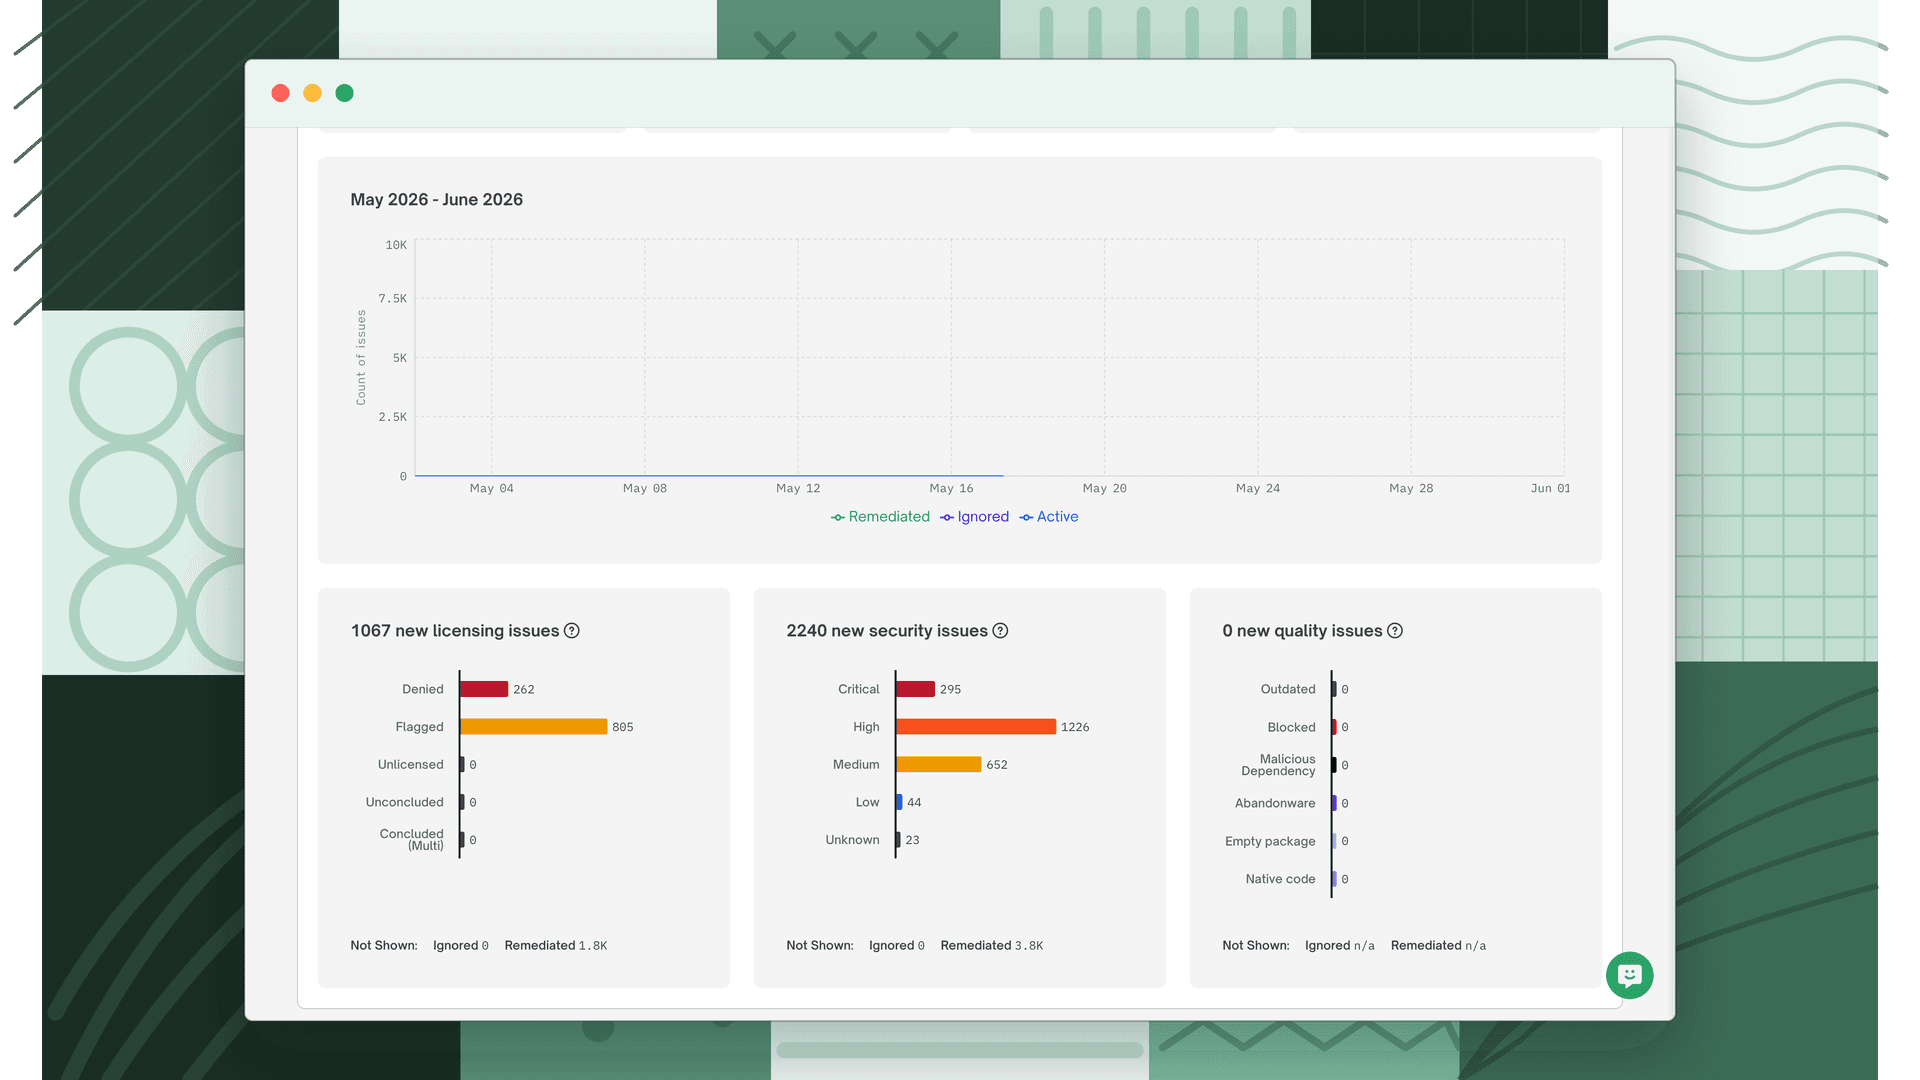
Licensing
Always shown. Breaks down new licensing issues by type:
- Policy Conflict: dependencies that violate your policy rules
- Policy Flag: dependencies flagged for review
- Unlicensed Dependency: dependencies with no detected license
Security
Shown when the Security feature is enabled. Breaks down new vulnerability issues by severity:
- Critical, High, Medium, Low, Unknown
Quality
Shown when the Quality feature is enabled. Breaks down new quality issues by type:
- Blocked Dependencies: dependencies prohibited by your quality policy
- Outdated Dependencies: dependencies behind the version threshold
- Risk indicators: abandonware, native code, empty packages
Exporting
Click Export to generate a report of the current view. The export is processed as a background job and emailed to you when ready; you don't need to stay on the page.
The export reflects the active filters at the time you click Export, so filter to the scope you need before exporting.
To download issue counts over time as a CSV for a team, use the Global Issue CSV Export on the Reports page.
Access
The Global Issue Summary requires view permission for at least one issue type. Security and Quality sections are hidden unless those features are enabled for your organization. The dashboard is not available on the free tier.